1 Introduction
With the increasing
urbanization process that has become more rapid since 1950, the natural
phenomena of floods are interrupted by human settlements which cause changes
and increase the risks associated with them (PONTE et al., 2014). Thus,
with the lack of urban planning, this occupation occurred with an inadequate
infrastructure. This generates a series of environmental and social problems,
such as the occupation of riparian areas and the waterproofing of the
watershed, caused by the paving of large areas and the construction of
buildings, resulting in decreased soil retention and infiltration capacity.
This waterproofing of large areas causes a change in the natural water balance,
generating a large increase in the surface runoff and drastic changes in
rainwater hydrographs observed in the occupied river basin.
The increase in the
surface runoff results in urban floods in conjunction with a poorly planned
urbanization process that is characterized by poor land use, occupation of risk
areas, inefficiency along with lack of maintenance of public drainage systems
and failures in the processing of waste collection and disposal (REIS et al.,
2008).
Although the flood
is a natural phenomenon of the river regime that is characterized by the
elevation of the water level caused by the increase of the flow rate, reaching
the maximum quota without extravasation, and even though every river has its
area of flood, that is, when a watercourse overflows reaching marginal areas
(PINTO and PINHEIRO, 2006), the frequency and severity of floods show that the
traditional drainage systems adopted become insufficient as the occupation of
the river basin intensifies.
Thus, the
conventional drainage system currently used in most Brazilian cities is
insufficient, since it aims to quickly drain the water from precipitation, thus
transporting the drainage problem to a point downstream, resulting in more
extensive galleries. As a consequence, unconventional drainage measures should
be taken in order to solve the problem without transferring it elsewhere.
Nevertheless, the
city of Carazinho located in the northern region of the Brazilian Rio Grande do
Sul State is located at a point considered as a watershed and it is inserted in
two hydrographic regions. According to the Municipal Basic Sanitation Plan of
2015 (PMSB), the northwest region of the urban area of the city is inserted in
the Uruguay Hydrographic Region, Basin of the Várzea River. Regarding the
southeast region of the urban area of the municipality, it is in the Guaíba
Hydrographic Region, Upper Jacuí Basin. The watershed considered by the PMSB is
Flores da Cunha Avenue, the main street of the city.
The micro drainage
system of the city consists of galleries built on concrete pipes and curb-opening
inlets. On the other hand, the macro drainage system is composed of streams and
rivers that pass through the city. As for the flooding problems in the city due
to more intense rainfall, these are temporary and caused by the obstruction of
gutters and street inlets as a result of improperly discarded solid waste,
paving and waterproofing of the ground attributable to urbanization, lack of
maintenance and cleaning of the micro drainage system and also to the inability
of the system to collect the entire volume of water from the surface runoff.
Therefore, urban
drainage now requires a more sustainable approach to be effective. In this way,
solutions are sought for the infiltration of precipitated water in the soil or
its detention in order to reduce the volume of precipitation drained in the
gutters and galleries. This would create points that allow the recharge of
aquifers, besides reestablishing the natural water balance and reduce the
occurrence of floods, as well as consequently minimizing the impacts that the
waterproofing causes to the environment and to the population.
In the present
work, it is presented a study based on the field survey at critical points of
flooding caused by rainfall in the city of Carazinho, located in the northern
region of the Rio Grande do Sul State which has 62,193 inhabitants and is
665,092 km² (IBGE, 2016). Thus, the present study is justified by the need to
seek other solutions to urban drainage, in order to combine these systems and
to mitigate the socio-environmental impacts caused by the impermeabilization of
urban areas in the hydrological cycle and in the behavior of the river basins.
Therefore, it was sought to verify the possibility of the application of
unconventional drainage measures and their effectiveness based on some
districts of the city of Carazinho which present problems of flooding. So, the
study was developed in the Centro District on Marquês de Pombal Street and in
the Floresta District on São Bento Avenue.
2 Methodology
The existing topography,
carrying out the analysis of the Municipal Plan of Basic Sanitation and the
Manual of Drainage of other municipalities, and studies of available literature
were all considered. After the diagnosis of the existing micro drainage system,
checking the quantity and types of street inlets, the height of the curb, the
existence or not of gutters, the type of pavement and the transversal profile
of the road, the evaluation of the control measures for each location was
carried out. The hydraulic capacity of the street inlets existing in the
drainage system of one of the chosen sites which has a mapping of them in the
Municipal Basic Sanitation Plan was verified. In addition, the design of the
unconventional measures chosen, that is, of the infiltration trenches and the
reservoir to collect and reserve rainwater, was also accomplished.
In the final stage
of the study, the effectiveness of the use of unconventional along with the
conventional measures in the drainage system was verified, taking into account
the feasibility of application. This comparison was made by plotting the
surface runoff hydrograms directly from each area. In addition, problems were
identified in the micro drainage system of the municipality that are possibly
contributing to the emergence of flooding points. These include obstruction of
the street inlets by the deposit of solid waste with an incorrect disposition,
lack of maintenance of the system, lack of design of the micro drainage system
of the city and the undue occupation of the river banks that cross the city.
The development of
the research method was better presented in the flowchart of Figure 1.
Figure 1 − Flowchart
of the developed method
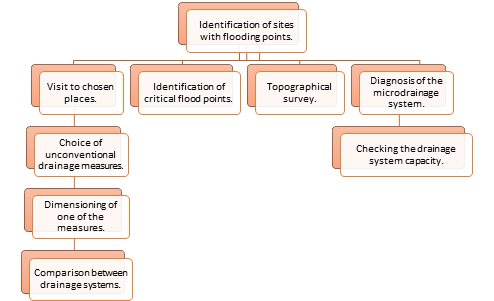
Source: Own elaboration (2016)
3
Results and Discussion
3.1 Diagnosis of the Micro
drainage System
The micro drainage
system in one of the survey sites chosen for the study, located on Marquês do
Pombal Street in the Center District, has five grated inlets and two curb-opening inlets, as well as two combined
street inlets. The dimensions of these street inlets vary widely and many of
them are in poor conservation status, as well as partially obstructed by solid
waste.
The type of
pavement existing in the place is parallelepiped, with the exception to the
street perpendicular to the flooding point, Ernesto Alves Street which is
asphalted. The height of the curb varies between 10 cm, 12 cm, 15 cm and 20 cm
in the different streets and the walkways has a standardized width of 2 meters.
Figure 2 shows the
flooding point at the Marquês do Pombal Street and one of the street inlets in
precarious conditions found on the site.
Figure 2 – Photographic
records at the first flooding point
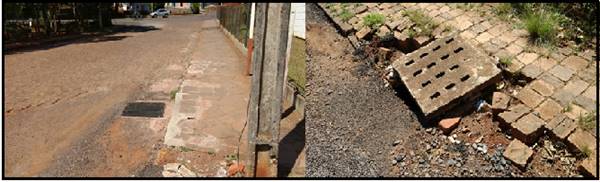
Source:
Own elaboration (2016)
The second flooding
point under study in the present work is located on São Bento Avenue, near the
intersection with Monte Alegre Street in the Floresta District. The area of
contribution to the emergence of this flooding point has two different street inlets:
curb-opening inlets and grated inlets. The curb-opening inlets only exist on
Florianópolis Street, so the type of the street inlet that prevails in this
area is the grated inlet. However, they are partially obstructed by vegetation,
thus demonstrating the lack of maintenance in the drainage system and,
consequently, compromising the hydraulic capacity of the street inlet and the
drainage system as a whole. Most of the grated inlets have dimensions of 60 cm
by 60 cm, being distributed mainly in the corners, but in some cases, they are
located in the middle of the blocks. Nevertheless, they are in poor condition
and obstructed by solid waste discarded incorrectly by the population.
Furthermore,
there are three types of pavement surface present in the streets that form the
study area: parallelepiped, asphalt and macadamized way. Only São Bento Avenue,
Monte Alegre Street, and Florianópolis Street are paved with asphalt. Figure 3
shows the flooding point on São Bento Avenue and one of the street inlets found
on the site, obstructed by solid wastes and in precarious conditions.
Figure 3 – Photographic
records at the second flooding point
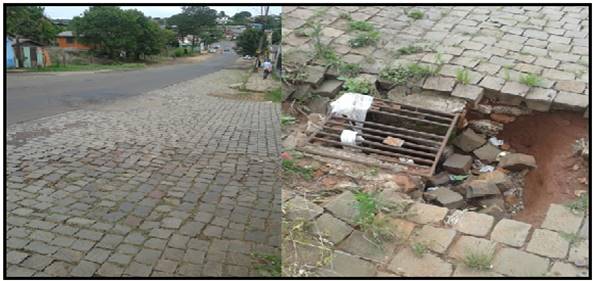
Source:
Own elaboration (2016)
3.2 Choice of the Unconventional Control Measures
Due to the
conditions found in the places where there is occurrence of flooding, such as
the available space for the implantation of some unconventional drainage,
infiltration trenches were chosen which consist of a lateral drainage device.
They are generally used parallel to the streets and the reservoirs that collect
and reserve rainwater. These solutions were chosen due to the feasibility of
the execution of the reservoirs that collect and reserve rainwater in the front
indents of the buildings and of the trenches along the routes, exploring the
sidewalks and the middle third of the road, and depending on the possible
interferences of other infrastructure systems. Therefore, in order to determine
the sizing of the drainage control devices, it was necessary to identify and
delimit the areas contributing to the emergence of flooding points in the
chosen sites. Thus, the values found for the contribution areas at the
flooding points in the Centro and Floresta Districts are 18.3 ha and 24.5 ha,
respectively.
Analyzing Figure 5,
it can be concluded that it is necessary to distribute the trenches through the
various routes, that is, several trenches of different dimensions are required
which together must meet the needs of the area.
Figures 4 and 5
present the contribution areas for each flooding point chosen for the study,
delimited in red line, with flooding points highlighted in the red area.
Figure
4 – Area of contribution of the flooding point on Marquês do Pombal Street
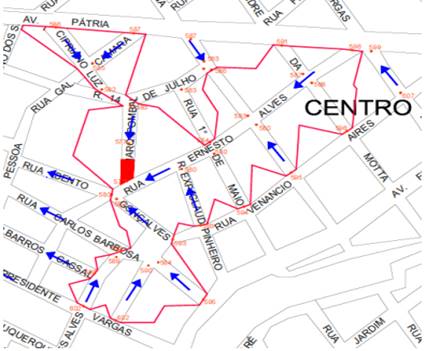
Source:
Own elaboration (2016)
Figure 5 – Area of
contribution of the flooding point on São Bento Avenue
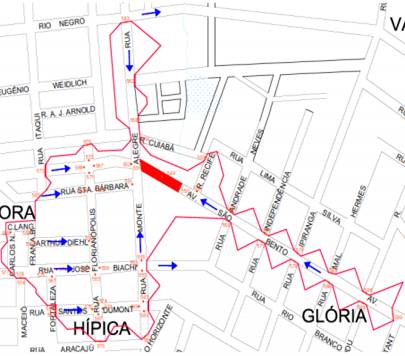
Source:
Own elaboration (2016)
According to
Caputo (2012), the success of adopting alternative drainage control measures
depends on a thorough analysis of the adaptability to the conditions in each
site and the correct design decision, which is the choice of measurement,
sizing and possibility of simulate the operation of these measures in different
contexts.
The different types
of control measures have both strengths and weaknesses according to their application,
and the limitations of these structures are in many cases due to the physical
characteristics of the site of implantation, risk of contamination of the water
table, cost, maintenance need, hydrological characteristics, climate, and
others.
Thus, the
implementation of unconventional control measures presents certain risks -
although the innumerable benefits are visible- such as operation and
maintenance which when not appropriate from the beginning may result in a
reduction of the effectiveness of the purpose that the control measure was
designed. Therefore, the choice of a type of system undergoes a global
analysis, in which aspects such as urbanization, existing infrastructure in the
locality, costs and, evaluation of the fulfillment of the criteria necessary
for the good functioning of the devices are considered.
3.3 Infiltration Trench Sizing
The method chosen
to carry out the trenches sizing was the Rain-envelope-method, a method that
uses the direct application of characterization data of the implantation site
of the infiltration device and of the IDF curve. It is based on the
determination of accumulated inflow and outflow volumes of the infiltration
trench. According to the Prefeitura de Porto Alegre (2005), "the
volume of the device should be sufficient to store the maximum difference
between the accumulated volumes of entry and exit (taking into account the
porosity of the filling material)."
Therefore, the
material chosen for the present study was gravel, which is abundantly available
in the region having an effective porosity of 30% as shown in Table 1.
Table 1 – Effective porosity of filling
materials
|
Material
|
Effective Porosity (%)
|
|
Gravel
|
30
|
|
Gravel of uniform granulometry
|
40
|
|
Graduated brita (less than 1/4")
|
30
|
|
Sand
|
25
|
It was adopted 5
years as the return period in all calculations, since the flooding points are
located in urbanization sites that have not yet been fully consolidated, and
this value can be suggested in the bibliography for the planning of micro drainage
systems.
For the flow
coefficient (C), the theory of the method chosen for the sizing of the trenches
indicates values between 0.85 and 0.95. These values are conservative and are
indicated for areas where urbanization is already consolidated, which is not
the case of the study sites. At the flooding point on Marquês do Pombal Street,
the environment is in a phase of transformation where the area ceases to be
only residential and starts to count on public buildings and law offices.
Consequently, it becomes more urbanized, even though the predominance is of low
buildings. At the flooding point on São Bento Avenue, the taxpayer area is
still predominantly residential with no fully consolidated urbanization.
In
this way, a reduction in the value of the flow coefficient was chosen, and the
value used for both cases in all calculations is equal to 0.60. The main source
of consultation for the sizing parameters was the Porto Alegre Drainage Manual,
which also shows tabulated values for soil hydraulic conductivity (l/m².day)
already transformed into infiltration coefficients (mm/h), considering some
soil types, classifying them from A to D and separating them based on the soil
texture. Thus, the values found were 2.7 mm/h or 3.53x10⁻⁶ m/s,
considering that the soil of the municipality is a type B soil, according to
the description in the Porto Alegre Drainage Manual (2005): "soils less
permeable than the previous one, sandy soils less deep than type A and with
higher than average permeability."
3.4 Sizing of the first flooding point -
Marquês do Pombal Street
The sizing of the
flooding point was carried out, firstly, without the application of the
reduction factor for the saturated hydraulic conductivity of the soil and with
the data presented in Table 2. Moreover, the final dimensions obtained in order
to obtain a volume value (Vdim) near the value of the trench volume
(VT) are shown in Table 3.
Table 2 – Trench dimension data
|
Data
|
|
Basin
contribution area (ha)
|
18.3
|
|
Flow
coefficient
|
0.6
|
|
Saturated
hydraulic conductivity - k (m/s)
|
0.00000353
|
|
Reduction
Factor
|
2
|
|
k
reduced (m/s)
|
1.765E-06
|
|
Return
period (years)
|
5
|
|
Porosity
|
0.3
|
Table 3 – Dimensions of the trench
|
Estimated Dimensions
|
|
Length
(m)
|
6000
|
|
Width
(m)
|
1
|
|
Height
(m)
|
2.5
|
Width of 1 m and
height of 2.5 m were adopted because these dimensions are compatible with the
walkways and if necessary, due to the physical interference of the place, they
can also be executed in the middle third of the track, that is, in the next
track to the curb in the canopy. Thus, with these values, it was reached the
percolation area and the trench volume values shown in Table 4.
In order to obtain
a curve of input and output volumes of the trench, a time interval between 10
and 30 minutes was used, this interval being varied every 5 minutes and, as
result, it was obtained the data presented in Table 5.
Table 4 – Data for the dimensioning of the
trench
|
Initial Calculations
|
|
Trench volume (m³)
|
15000
|
|
Percolation area (m²)
|
30005
|
Tabela 5
– Data of the input and output volume curve of the trench
|
Affluent
and exit volume curves of the trench
|
|
t (min)
|
t (hours)
|
IT
(l/s/ha)
|
Ve (m³)
|
Vs (m³)
|
Ve - Vs (m³)
|
|
10
|
0.17
|
308.98
|
2544.41
|
31.7753
|
2512.64
|
|
15
|
0.25
|
257.49
|
3180.62
|
47.66294
|
3132.96
|
|
20
|
0.33
|
222.48
|
3664.22
|
63.55059
|
3600.67
|
|
25
|
0.42
|
196.93
|
4054.28
|
79.43824
|
3974.84
|
|
30
|
0.50
|
177.35
|
4381.54
|
95.32589
|
4286.22
|
The largest
difference between the entrance and exit volumes of the trench (Ve - Vs) was
used to obtain the dimensioned volume value, dividing the maximum value of (Ve
- Vs) by the porosity value of the filling material of the trench. Thus, a
value for Vdim equal to 14287.4 m³ was found, which approaches the
VT value (15000 m³). So, it is possible to affirm that the dimensions of the
infiltration trench necessary to penetrate the entire surface runoff of the
area are 2.5 m high, 1 m wide and 6000 m long.
The calculations
presented above were redone using a safety factor of 2 for the saturated
hydraulic conductivity of the soil, as o make it equal to 1.765x10⁻⁶
m/s. The other data used for the sizing remained the same.
However,
even with the use of the reduction factor, the area required for the
infiltration trench remains the same as the trench area without the use of the
safety factor in the sizing. This is because the soil hydraulic conductivity
values are very small and therefore do not cause significant changes in the
results found.
3.4 Analysis of the applicability of
infiltration trenches at the first flooding point – Marquês do Pombal Street
In order to verify
if the dimensions of the infiltration trenches determined previously are
possible to be applied in the study sites, some aspects were analyzed such as
inclination of streets, width of walkways and conservation conditions, stock of
poles, trees or some other type of vegetation and also, the existence of any
obstacle that could prevent the application of the trench on the site.
In the area that
contributes to the emergence of the flooding point on Marquês do Pombal Street,
it was verified that due to large slopes of the streets, only two streets are
suitable for the implantation of the infiltration trenches - Ernesto Alves
Street and Primeiro de Maio Street.
Depending on the
width of the walkways, the width of the trench should be 50 cm so that the
trench is better suited to the location in question. There is no need to modify
the height, so it remains 2.5 m. On the other hand, adding up the spaces
available for the implementation of the trench, there is a total of 810 m in
length that is much smaller than the 6000 m that were initially estimated.
Thus, the estimated dimensions at the beginning of the infiltration trench
design would be for it to retain and penetrate all surface runoff; however this
is not the goal of the implantation of this device. The application of the
infiltration trench is aimed at reducing the surface runoff in order to avoid
that the excess of the same, not supported by the conventional micro drainage
system, causes flooding and disturbances for the population. Thus, the new
dimensions of the infiltration trench at the first flooding point are presented
in Table 6.
Tabela 6
– Final dimensions of the infiltration trench
|
Estimated
Dimensions
|
|
Length
(m)
|
810
|
|
Width
(m)
|
0.5
|
|
Height
(m)
|
2.5
|
3.5
Dimensioning and analysis of the applicability of infiltration trenches at the
second flooding point – São Bento Avenue
In the dimensioning
of the second flooding point, the only value that differs from the first point
is the contribution area, which, in this case, is equal to 24.5 ha. The data
obtained are shown in Table 7.
Table 7 – Trench dimension data
|
Data
|
|
Basin contribution area (ha)
|
24.5
|
|
Flow coefficient
|
0.6
|
|
Saturated hydraulic conductivity - k
(m/s)
|
0.00000353
|
|
Reduction Factor
|
2
|
|
k reduced (m/s)
|
1.765E-06
|
|
Return period (years)
|
5
|
|
Porosity
|
0.3
|
As before, the
first dimensioning was performed without the use of the safety factor. The
dimensions of the trench are shown in Table 8, the initial calculation of the
dimensions of the trench is presented in Table 9 and in Table 10 the data of
the curve of incoming and outgoing volumes of the infiltration device is
visualized.
Table 8 – Dimension of the trench
|
Estimated
Dimensions
|
|
Length (m)
|
7800
|
|
Width (m)
|
1
|
|
Height (m)
|
2.5
|
Table 9 – Data for dimensioning the trench
|
Initial
Calculations
|
|
Trench volume (m³)
|
19500
|
|
Percolation area (m²)
|
39005
|
Table 10 – Data of the input and output
volume curve of the trench
|
Affluent
and exit volume curves of the trench
|
|
t(min)
|
t (horas)
|
IT
(l/s/ha)
|
Ve (m³)
|
Vs (m³)
|
Ve - Vs (m³)
|
|
10
|
0.17
|
308.98
|
3406.46
|
41.3063
|
3365.15
|
|
15
|
0.25
|
257.49
|
4258.21
|
61.95944
|
4196.25
|
|
20
|
0.33
|
222.48
|
4905.65
|
82.61259
|
4823.04
|
|
25
|
0.42
|
196.93
|
5427.87
|
103.2657
|
5324.60
|
|
30
|
0.50
|
177.35
|
5866.00
|
123.9189
|
5742.08
|
The largest
difference between the entrance and exit volumes of the trench was
approximately 5742.08 m³, which was later divided by the porosity value of the
fill material (0.3). Thus, the value obtained for the volume dimensioned was 19140.28
m³, which approaches the value of the volume of the trench that is 19500 m³.
Therefore, the dimensions of the infiltration trench that would be required to
penetrate the entire surface runoff of the area are 2.5 m high, 1 m wide and
7800 m long.
The sizing was
redone using a safety factor of 2 for the saturated hydraulic conductivity of
the soil, so that it started to present a value of 1.765x10⁻⁶ m/s.
The other parameters used for the sizing remained the same. Also, as previously
noted, the use of the safety factor does not modify the area required for the
implantation of the infiltration trench.
3.6 Analysis of the applicability of
infiltration trenches at the second flooding point - São Bento Avenue
In the area that
contributes to the emergence of the second flooding point on São Bento Avenue,
it was observed that several streets do not have sidewalks and others have very
narrow walkways and vegetation growing in them, so these streets were discarded
from the analysis of the viability of infiltration trenches.
The estimated
dimensions for the infiltration trench at the second flooding point were 1 m
wide, 2.5 m high and 7800 m long, but as in the previous case, depending on the
width of the walkways, the width should be smaller so that the trench adapts to
the study site, that is, 70 cm. As for height, there is no need for it to be
modified, remaining 2.5 m. On the other hand, adding up the spaces available
for the implementation of the trench, there is a total of 690 m in length -
much smaller than the 7800 m initially estimated.
As in the first
flooding point, the dimensions that were estimated at the beginning of the
infiltration trench calculation would be for it to retain and penetrate all
surface runoff, which is not the purpose of installing this device. Thus, the
new dimensions of the infiltration trench at the second flooding point are
shown in Table 11.
Table 11 – Final dimensions of the
infiltration trench
|
Estimated Dimensions
|
|
Length
(m)
|
690
|
|
Width
(m)
|
0.7
|
|
Height
(m)
|
2.5
|
3.7 Sizing of the
Delayed Reservoirs
Reservoirs that
collect and reserve rainwater are source control devices that temporarily store
surface runoff water in local reservoirs. In order to carry out its design, the
city of Sao Paulo used "Piscininhas Law". The formula for determining
the capacity of the reservoirs that collect and reserve rainwater is simple and
the variables used in it, with the exception of the waterproofed area, are
already established. Thus, the reservoir volume is found through Equation (1).

(1)
Where:
“V” is the volume
of the reservoir (m³), “Ai” is the waterproofed area (m²), “IP” is the rainfall
index being equal to 0.06 m/h and “t” is the rain duration time (1 hour).
For the sizing of
the reservoirs, a standard 12x30 m plot was considered corresponding to an area
of 360 m². As each flooding point is located in different zones of urban
occupation, according to the Master Plan of the municipality, the reservoirs
were designed for 85% occupancy rates for Marquês do Pombal Street – inserted
in the Commercial and Services Zone 1 (ZCS 1), and 80%, 60% and 50% for São
Bento Avenue – inserted in the Commercial and Service Corridor 1 (CCS 1),
Commercial and Service Corridor 2 (CCS 2) and Residential Zone 1 (ZR 1). Thus,
the volumes of the reservoirs that collect and reserve rainwater found were 2.754
m³ for ZCS1 – Marquês do Pombal Street – 2.592 m³ for CCS1, 1.944 m³ for CCS2
and 1.62 m³ for ZR1, both on São Bento Avenue.
Therefore, the
increase in concentration time due to reservoirs that collect and reserve
rainwater using the Passo Fundo rainfall intensity equation was analyzed, with
a 5-year return period and 5-minute concentration time. With these data, a
precipitation value of 141.74 mm/h was reached.
For the
determination of the flow rate of the reservoirs that collect and reserve
rainwater, the Rational Method was used, equation 16, with water outflow
coefficient of 0.6 and the same areas used in the calculation of the volumes of
the reservoirs. Subsequently, it becomes possible to calculate the filling time
of the same - determined by dividing the volume of the reservoir by the flow
rate of the same. The results are shown in Table 12.
Table 12 – Data obtained according to the
occupation zones for the dimensioning of the delay reservoirs
|
Occupation zone
|
Flow rate (L/s)
|
Reservoir
volume (m³)
|
Reservoir
volume (L)
|
Filling
time (s)
|
Filling
time
(min)
|
|
|
|
ZCS 1
|
7.23
|
2.754
|
2754
|
380.91
|
6.349
|
|
|
CCS 1
|
6.8
|
2.592
|
2592
|
381.18
|
6.353
|
|
|
CCS 2
|
5.1
|
1.944
|
1944
|
381.18
|
6.353
|
|
|
ZR 1
|
4.25
|
1.620
|
1620
|
381.18
|
6.353
|
|
As the filling time
values for the reservoirs to collect and reserve rainwater are very close, it
was possible to verify that, in all the zones of occupation, the filling time
of the reservoirs is equal to 6.35 minutes.
3.8 Comparison of conventional and unconventional drainage
systems
The comparison
between conventional and unconventional drainage systems was performed by means
of graphs and the plot of the direct surface flow unit hydrograms. Figure 6
shows the comparison between flow rates, in m³/s, at the first flooding point
on Marquês do Pombal Street and at the second flood point on São Bento Avenue.
Figure 6 – Comparison charts between flow
rates at flooding points
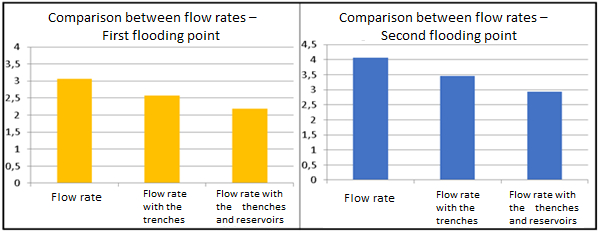
Source:
Own elaboration (2016)
Furthermore, the
direct surface flow hydrograms were drawn for a time equal to one hour. In
Figure 7, the hydrograms are shown for the one hour interval referring to the
first and second flooding points. Both hydrographs present the flow rates for
the three distinct hypotheses - the first hypothesis considers the
concentration time found for each area plus 5 minutes which is the average time
that leads to the water falling on the roofs to flow to the ground, the second
hypothesis considers the time of filling of the trenches added to the time of
the previous hypothesis, while the third hypothesis considers all the times
previously mentioned added to the time of filling of the reservoirs that
collect and reserve rainwater.
Figure 7 – Hydrographs of flooding points

Source:
Own elaboration (2016)
Analyzing the
graphs of Figure 6, it is possible to detect a significant reduction of flow
rate by comparing the value in the first flooding point under study with the
conventional micro drainage system only to the flow results obtained through
the implementation of the unconventional control measures. The reduction in
flow with the implementation of the infiltration trenches is approximately 16%
and when considering the trenches and the reservoirs that collect and reserve
rainwater, this reduction reaches almost 29%. In addition, a significant
reduction in flow rate is observed by comparing the value of only the
conventional micro drainage system that exists in the second flooding area
under study with the flow rate results obtained through the implementation of
the unconventional control measures. The reduction in flow rate with the
implementation of the infiltration trenches is almost 15% and when considering
the trenches and the reservoirs that collect and reserve rainwater, this
reduction reaches approximately 27.5%.
With regard to
Figure 7, the rise time of the hydrograms varies according to each hypothesis.
Nevertheless, it is important to note that with the implementation of
unconventional drainage control measures, such as infiltration trenches and reservoirs
that collect and reserve rainwater, the hydrograph concentration times increase
and the flow spikes decrease, resulting to a better distributed surface runoff
over time and, thus, avoiding the emergence of flooding points.
4 Final Considerations
The floods in the
municipalities are due to uncontrolled urban occupation and without planning,
thus causing the waterproofing of large areas and generating exacerbated
surface runoff since the water cannot penetrate the soil. Another cause of
flooding in cities is the design of the drainage system, which currently does
not seek to solve the problem, but rather to transfer it to a downstream point.
It results in systems that seek to drain water as quickly as possible and that
lead the excess of surface runoff to another place without worrying about the
volume drained.
Therefore, the
control of drainage at the source emerged as an alternative to solve the
problem, based on techniques such as infiltration and the reservation of excess
surface runoff, described in drainage manuals of municipalities
In the diagnosis of
the micro drainage system in the study, for the sites located in the
municipality of Carazinho, there was no maintenance of this system. Some street
inlets here were extremely precarious conditions and others partially
obstructed by residues solids. Furthermore, gutters, when present, were also in
poor condition. The height of the curb in the areas of contribution of the
points under study varied, having in some points heights between 10 and 12 cm
and in others 20 cm, this being a value considered high for a curb height.
Regarding the
implantation of the trenches, not many sidewalks were found in the municipality
with adequate conditions so that these could be implemented, either by the
great slope of the streets, by the width or nonexistence of the walkways. However,
it is important to emphasize that this measure reduced the flow rate in a
considerable way, for the first flooding point was reduced by 16% and in the
second flooding point by 15%.
The use of the
delayed reservoirs, along with the infiltration trenches, provided an even
bigger decrease in the flow at the flooding points. Consequently, concentration
times at these sites also increased with the use of unconventional control
measures. The calculated concentration time for the contribution areas without
the infiltration and delay devices were 12.7 and 13 minutes for the first and
second flooding point respectively. With the infiltration trenches, the times
passed to 18.2 and 18 minutes, accounting an increase of 43% and 38.5% in each
case. The total increase in concentration time with trenches and delay
reservoirs was 93% at the first flooding point and 87% at the second flooding
point.
Therefore, the
implantation of the unconventional measures, as a matter of fact, practically
doubles the time of concentration of the surface runoff, generating
considerable reductions in the flow peak in each contribution area.
Thus, it is
recommended to use unconventional drainage control measures along with the conventional
micro drainage systems in order to reduce excess runoff. To do this, however,
there must be carried a more profound analysis at the place where the control
device is planned, in order to determine which type of measure will be more
adequate according to the existing conditions in each place, highlighting the
interference with urban water and sewage systems. Finally, it is essential to
emphasize that, in addition to decreasing peak flows and reducing flooding
problems, these control measures are sustainable and more convenient for the
urban environment, as far as socio-environmental issues are concerned.
References
CAPUTO, Ú. K.. Avaliação do Potencial de Utilização
de Trincheiras de Infiltração em Espaços com Urbanização Consolidada. 2012.
Dissertação (Programa de Pós Graduação em Saneamento, Meio Ambiente e Recursos
Hídricos). Universidade Federal de Minas Gerais, Belo Horizonte.
DAMIÃO, M.; FELDON, A.; MUKAI, G.; ROSA, A.; UECHI, M. Lei
das Piscininhas. Universidade de São Paulo, 2010.
PINHEIRO, S. A.; PINTO, L. H. Orientações Básicas
para Drenagem Urbana. Belo Horizonte, 2006. Disponível em: http://www.feam.br/images/stories/arquivos/Cartilha%20Drenagem.pdf.
Acesso em 03 ago. 2016.
PINTO, L. H.; PINHEIRO, S. A.. Orientações básicas
para drenagem urbana. Belo Horizonte, 2006.
PONTE et al. 2014. Urbanização e drenagem urbana:
concepções divergentes na Bacia da Estrada Nova, Belém-PA. 3 Seminário sobre o
Tratamento de Áreas de Preservação Permanente em Meio Urbano e Restrições
Ambientais ao Parcelamento do Solo, p. 3.
PREFEITURA MUNICIPAL DE PORTO ALEGRE. Departamento de
Esgotos Pluviais. Plano Diretor de Drenagem Urbana: Manual de Drenagem
Urbana. Volume VI. Porto Alegre, 2005.
SILVA, J. P.. Estudos Preliminares para Implantação
de Trincheiras de Infiltração. 2007. Dissertação de Mestrado da
Universidade de Brasília. Distrito Federal.
TRINDADE, S. Subsídios para implantação de
trincheiras de infiltração na área urbana de Rio Claro/SP. 2009. Trabalho
de Conclusão de Curso (Curso de Engenharia Ambiental), Instituto de Geociências
e Ciências Exatas – Unesp, Rio Claro.