4 CONCLUSIONS
REFERENCES
Environment
Study of the application of biomass, biochar and hydrochar from acerola waste (Malpighia Emarginata D.C.) as biosorbents for methylene blue in aqueous solution
Estudo da aplicação de biomassa, biocarvão e hidrocarvão de resíduo de acerola (Malpighia Emarginata D.C.) como biossorventes de azul de metileno em solução aquosa
Gabriela Regina Rosa GaliassiI 
Elaine de Arruda Oliveira CoringaI
Josias do Espírito Santo CoringaI
I Instituto Federal de Educação, Ciência e Tecnologia de Mato Grosso, Cuiabá, MT, Brasil
ABSTRACT
Fruit cultivation is a key activity in Brazil, positioning the country as the third-largest global fruit producer due to favorable climatic conditions. Acerola (Malpighia Emarginata D.C.), originally from Central America, is primarily produced in Brazil. Its high perishability often leads to processing, generating significant waste. This study investigates the potential of slow pyrolysis and hydrothermal carbonization for repurposing acerola by-products. Slow pyrolysis converts biomass through moderate heating and extended residence times, while hydrothermal carbonization employs high temperatures and water in a reactor. The solid outputs, biochar and hydrochar, are rich in oxygenated functional groups. This research characterized acerola waste, produced biochar and hydrochar, and evaluated their methylene blue dye adsorption capacities. Results show maximum adsorption capacities of 65.57 mg g–¹ for biomass, 29.98 mg g–¹ for biochar, and 36.05 mg g–¹ for hydrochar without pH adjustment. Under optimal conditions, biochar and hydrochar achieved 97.94% and 98.66% dye removal, respectively, emphasizing the sustainable reuse of acerola waste for environmental applications.
Keywords: Agro-industrial waste; Adsorption; Bioproducts
RESUMO
O cultivo de frutas é uma atividade-chave no Brasil, posicionando o país como o terceiro maior produtor global de frutas devido às condições climáticas favoráveis. A acerola (Malpighia Emarginata D.C.), originária da América Central, é produzida principalmente no Brasil. Sua alta perecibilidade frequentemente resulta em processamento, gerando resíduos significativos. Este estudo investiga o potencial da pirólise lenta e da carbonização hidrotérmica para o reaproveitamento de subprodutos da acerola. A pirólise lenta converte a biomassa por meio de aquecimento moderado e longos tempos de residência, enquanto a carbonização hidrotérmica utiliza altas temperaturas e água em um reator. Os produtos sólidos resultantes, biochar e hydrochar, são ricos em grupos funcionais oxigenados. Esta pesquisa caracterizou os resíduos de acerola, produziu biochar e hydrochar, e avaliou suas capacidades de adsorção do corante azul de metileno. Os resultados mostram capacidades máximas de adsorção de 65,57 mg g–¹ para biomassa, 29,98 mg g–¹ para biochar e 36,05 mg g–1 para hydrochar, sem ajuste de pH. Em condições ótimas, biochar e hydrochar atingiram remoções de corante de 97,94% e 98,66%, respectivamente, destacando o reaproveitamento sustentável dos resíduos de acerola para aplicações ambientais.
Palavras-chave: Resíduos agroindustriais; Adsorção; Bioprodutos
1 INTRODUCTION
Water pollution is one of the most pressing environmental issues that society faces today, requiring urgent attention from researchers and policymakers (Zhou et al., 2015; Kumar et al., 2023). This phenomenon arises from the indiscriminate release of various organic and inorganic pollutants, primarily stemming activities (Sahay et al., 2023). Industrial sectors such as textiles, petrochemicals, and agrochemicals, along with municipal wastewater production, significantly contribute to the degradation of water quality, leading to severe consequences for aquatic ecosystems and human health (Kumar et al., 2023; Bashir et al., 2023).
Although approximately 71% of Earth’s surface is covered by water and about 70% of the human body is composed of it, only about 2.5% of Earth’s water is freshwater, and less than 1% is readily accessible. Therefore, preserving water quality is vital for life sustainability (Souza et al., 2018; Mishra, 2023). The growth of urban and industrial areas has led to the contamination of water bodies, resulting in negative impacts on biodiversity and public health (Cruz et al., 2015). Studies reveal that the presence of aquatic pollutants is linked to health issues such as embryotoxicity and carcinogenicity, underscoring the urgent need for effective wastewater treatment technologies (Ali et al., 2012; Osman et al., 2023).
Various technologies have been applied to remove chemical pollutants, including flocculation, coagulation, and oxidative processes. Among these techniques, adsorption stands out for its cost-effectiveness and efficiency, once its capable of removing a wide range of both organic and inorganic pollutants without producing hazardous byproducts (Kumar et al. 2023; Bashir et al., 2023). The adsorption process involves the interaction between contaminants and adsorbents, which may occur through physical or chemical mechanisms depending on the substances (Peng et al., 2023).
The adsorbents used in pollutant removal processes vary from synthetic to natural materials, focusing on agricultural residues that demonstrate effectiveness in adsorption (Jawad et al., 2018). These materials offer advantages such as low cost and availability, besides, they are renewable sources that contribute to environmental sustainability (Zhou et al., 2015; Souza et al., 2018). Utilizing agricultural residues as adsorbents not only helps remove pollutants but also contributes to the valorization of materials that would otherwise be discarded.
The carbonization of biomass is an effective technique for producing natural adsorbents, yielding biochar with high adsorption capacity due to its porous structure (Buratti et al., 2018). Producing biochar from biomass, such as acerola waste, is promising since significant quantities of waste are generated during the processing of this fruit (Belwal et al., 2018)
The environmental implications of biomass carbonization must also be considered in terms of greenhouse gas emissions. While pyrolysis and hydrothermal carbonization processes emit CO2, they can also contribute to long-term carbon sequestration when biochar is applied to soil or used in environmental remediation. Thus, biochar not only serves as an efficient adsorbent but also plays a role in reducing net CO2 emissions by stabilizing carbon that would otherwise decompose and release greenhouse gases (Nogueira et al., 2019; Waheed et al., 2024; Shrestha, 2023).
In this context, the present study aims to evaluate the adsorption potential of biochar and hydrochar derived from acerola processing waste for the removal of methylene blue in aqueous solutions. In addition to these thermally modified materials, the raw acerola biomass is also assessed as a biosorbent to enable a comparative analysis of their performances. The research explores the feasibility of utilizing agricultural residues in the remediation of contaminated aquatic environments, thereby contributing to the establishment of more sustainable practices in wastewater management.
2 MATERIAL AND METHODS
All the experiments were conducted in Soil and Sediment Laboratory at Instituto Federal de Educação, Ciência e Tecnologia de Mato Grosso (IFMT), campus Cuiabá Bela Vista.
2.1 Raw Material Acquisition
Acerola fruit (Malpighia emarginata D.C.) were sourced from urban gardens in Cuiabá, MT, and collected at full ripeness. Approximately 5.0 kg of fruit were obtained and kept frozen at -5°C until processing. The frozen fruit were blended to extract the juice and pulp. The resulting residues, consisting of peels and seeds, were washed with distilled water to remove soluble organic fractions and undesirable debris. These residues were then stored in appropriate containers under freezing conditions until dry biomass processing, amounting to approximately 2.0 kg of processed residues.
2.2 Preparation of Dry Biomass from Residue (BMS)
The acerola processing residue was dried at 65°C in a forced-air oven until a constant weight was achieved. It was then ground using a ball mill and sieved to obtain microparticles of relatively uniform sizes, ranging from 0.125 to 2.00 mm (Hatiya et al., 2022).
2.3 Production of Biochar (BIO)
For biochar production, 300 mg of the biomass was weighed and placed in a 30 mL crucible with a lid, then subjected to pyrolysis in a Zezimaq N1030 furnace at 300 ± 20°C for 3 minutes. After carbonization, the sample was cooled in a desiccator, ground using a mortar and pestle, and stored in a sealed plastic container inside the desiccator.
2.4 Production of Hydrochar (HID)
The hydrothermal carbonization of BMS was conducted in a stainless steel autoclave, known as a hydrothermal reactor, with a capacity of 25 mL. In each trial, the biomass was dispersed in distilled water at a ratio of 1:10 (w/v) and transferred to the reactor. The system was maintained at a temperature of 180 ± 3°C for 6 hours, with a heating rate of 8.98°C/min. The timer began once the oven reached 180°C. After this period, the oven was turned off, and the hydrochar was allowed to cool to room temperature. The product was then filtered using a vacuum system, washed with distilled water, and dried at 105 ± 3°C for 4 hours. At the end of the process, the material produced was stored in an airtight container with a lid inside a desiccator.
2.5 Biosorbents Characterization
2.5.1 pH and Conductivity Determination (C)
The product was diluted with distilled water at a 1:10 (w/v) ratio in a 250 mL Erlenmeyer flask. The solution was stirred for 30 minutes and then allowed to stand for 10 minutes. The pH was measured using a Marconi MA-522 pH meter, and electrical conductivity was measured with a Marconi MA-521 conductivity meter, calibrated to 147.0 μS cm–¹ (Instituto Adolfo Lutz, 2008).
2.5.2 Determination of the Point of Zero Charge (PZC)
Twenty milligrams of the biosorbent were added to 20 mL of a 0.1 mol L–¹ NaCl aqueous solution under 12 different initial pH conditions (1 to 12), adjusted with 0.1 mol L–¹ HCl or NaOH solutions. The mixture was agitated at 100 rpm and 25°C for 24 hours to reach equilibrium. Subsequently, the final pH of the solution was measured using a Marconi MA-522 pH meter, calibrated with buffer solutions of pH 4, 7, and 10. A graph of pH variation (final pH - initial pH) versus initial pH was then constructed, from which the pH at the point of zero charge (PZC) was estimated (Deolin et al., 2013).
2.5.3 Determination of Oxygenated Functional Groups (OFG)
The determination was carried out according to the methodology described by Boehm (1994). Briefly, 0.5 g of the sample was added to 50 mL of a 0.1 M sodium hydroxide (NaOH), 0.05 M sodium carbonate (Na2CO3), or 0.1 M sodium bicarbonate (NaHCO3) solution. The mixtures were agitated at room temperature for 24 hours. After this period, each solution was filtered, and 40 mL of hydrochloric acid (HCl) was added to each filtrate. The resulting solution was heated to boiling, and the excess reagent was titrated with 0.1 M sodium hydroxide (NaOH) (Nascimento & Oliveira, 2017).
In Boehm titration, it is considered that NaOH neutralizes carboxylic, lactonic, and phenolic groups; Na2CO3 neutralizes carboxylic and lactonic groups; and NaHCO3 exclusively neutralizes carboxylic groups. The content of carboxylic (QC), lactonic (QL), and phenolic (QF) groups was calculated using Equations 1, 2, and 3, respectively. The total content of oxygenated functional groups (OFG) was determined by summing the concentrations of carboxylic, phenolic, and lactonic groups.
where Vam is the volume used in the titration (mL), Vb is the volume used to titrate the blank, MMNaOH is the actual concentration of the NaOH solution, Ve is the initial volume of the solution used (L), Val is the aliquot volume taken from the filtrate (mL), and m is the sample mass (g)
2.5.4 Moisture content (MC) Determination
The moisture content was measured according to the procedures established by the Adolfo Lutz Institute (2008). A 1 g sample was weighed in a previously calibrated metal capsule. The sample was placed in an oven at 105 ± 3°C for 24 hours. After this period, the sample was removed from the oven and allowed to cool in a desiccator. Once the sample reached room temperature, it was weighed again. The calculation was performed using Equation 4.
|

|
(4)
|
where B = Mi, to obtain the moisture content on a wet basis (w.b.); B = Mf, to obtain the moisture content on a dry basis (d.b.); and Mi is the initial mass of the sample (g) and Mf is the final mass of the sample (g).
2.5.5 Ash Content (A) Determination
The ash content was determined using the method outlined in ASTM D 3174-04 (2004). Initially, 1 g of the sample was weighed in a porcelain crucible. The sample was then incinerated in a Zezimaq N1030 muffle furnace at 690 ± 10°C for 4 hours, with a heating rate of 18.47°C/min. The timing commenced upon reaching 690°C (ASTM E1534-93, 1998a). After combustion, the sample was cooled in a desiccator and subsequently weighed. The ash content was calculated using Equation 5.

where MA is the mass of the ash (g)
2.5.6 Determination of volatile material content (VM)
The volatile material content was quantified according to the ASTM E872-82 method (1998c), with some adaptations for using a muffle furnace. One gram of the sample was weighed in a crucible with a lid and then placed in the muffle furnace (Zezimaq N1030) at a temperature of 950 ± 20ºC for 6 minutes (Gonçalves, 2016). The percentage of volatiles in the sample was determined using Equation 6.
2.5.7 Determination of fixed carbon content (FC)
The fixed carbon content was assessed according to ASTM Standard D3172-89. For this determination, Equation 7 was applied, considering the previously measured contents as per ASTM INTERNATIONAL (2002).

2.5.8 Fourier Transform Infrared Spectrophotometry (FT-IR)
This analysis aimed to determine the functional groups and chemical bonds in the samples. The FT-IR spectra were obtained using a Shimadzu IRSpirit spectrophotometer, covering the range of 4000 to 400 cm-1. A total of 45 scans were performed with a resolution of 4 cm-1.
2.5.9 Thermogravimetric Analysis (TGA) and Thermogravimetric Derivative (DTG)
Thermogravimetric analyses were conducted to evaluate the thermal behavior of BMS and BIO using a Shimadzu DTG-60H apparatus in both inert and oxidative atmospheres. To investigate the pyrolysis processes, thermogravimetric analysis was performed under an inert atmosphere for the three by-products. The tests were conducted in an N2 6.0 atmosphere at a gas flow rate of 100 mL min–¹, in duplicates, with a heating rate of 10°C min–¹ up to 1200°C, using approximately 5 mg of each sample. Reduced heating rates were employed to better define the process stages and to minimize discrepancies between the sample’s actual temperature and the temperature recorded by the thermogravimetric system. This approach ensured greater homogeneity between the sample temperature and the surrounding thermobalance environment (Guimarães, 2021).
Thermogravimetric analysis in an oxidative atmosphere was performed to assess the recalcitrance (resistance to degradation or conversion of plant-based materials such as cellulose and lignocellulose) of the three adsorbents. These tests were conducted in atmospheric air at a flow rate of 100 mL min–¹, in duplicates, with a heating rate of 10°C min–¹ up to 1200°C, using approximately 5 mg of each sample (Guimarães, 2021).
2.6 Adsorption Experiments
Adsorption experiments were performed in batch mode and in triplicate to evaluate the potential of acerola residue by-products (BMS, BIO, and HID) as adsorbent materials for methylene blue (MB) dye in aqueous solution. The tests were conducted at the laboratory scale using 50 mL centrifuge tubes (Falcon), an orbital shaker (Marconi), and a vacuum filtration system. Briefly, the acerola residue by-products (BMS, BIO, and HID) were weighed, added to the methylene blue solution, stirred at 150 rpm using the orbital shaker, and subsequently filtered. The resulting filtrate was analyzed to determine the residual dye concentration, and the adsorption parameters were calculated.
For kinetic assays, MB solutions were prepared at the desired concentrations, and 50 mL of each solution were placed into separate tubes, with each tube corresponding to a specific time point for dye concentration measurement. The aqueous medium was maintained at a natural pH of 5.5. Subsequently, 0.1 g of biosorbent was added to each tube, and the contact time was recorded. The tubes were agitated and allowed to interact with the biosorbents (BMS, BIO, and HID) for periods ranging from 0 to 120 minutes. At each time interval, a tube was removed, the sample was filtered, diluted with distilled water, and the absorbance was measured at 665 nm using a HACH DR/4000 UV-VIS spectrophotometer, with distilled water as the blank. Methylene blue concentrations in the solutions were calculated from the measured absorbance using an analytical curve prepared with concentrations of 0.1, 0.5, 1, 2, 4, 6, 8, and 10 mg L–¹. Equilibrium was considered reached when three consecutive absorbance readings were identical.
To construct the adsorption isotherms, 50 mL of MB solutions with various initial concentrations were used. The pH was maintained at 5.5, matching the natural pH of the solution. A 0.1 g portion of biosorbent was added to the tubes, and the contact time was set at 120 minutes. Afterward, the samples were filtered, diluted, and the dye concentrations were measured as described for the kinetic assays.
To assess the effect of solution pH on adsorption, MB solutions with pH values ranging from 2.0 to 12.0 were prepared. Adjustments to the pH were made using 0.1 mol L–¹ HCl and NaOH with a Marconi MA-522 pH meter. The biosorbent-to-solution ratio (m/V) was kept consistent with previous assays, and the contact time was set to the equilibrium time determined in the kinetic studies. The samples were subsequently filtered, diluted, and dye concentrations were measured as described earlier. Table 1 summarizes the experimental conditions used in the adsorption study.
Table 1 – Experimental conditions of adsorption tests
|
Adsorption Kinetics
|
Equilibrium isotherms
|
Influence of the pH of the solution
|
|
Volume (mL)
|
50
|
50
|
50
|
|
Agitation (rpm)
|
150
|
150
|
150
|
|
Time (min)
|
0 – 120
|
120
|
60
|
|
pH
|
5.5
|
5.5
|
2.0 – 12.0
|
|
MB (mg L-1)
|
100
|
25 - 200
|
100
|
Source: Organized by the authors (2024)
The adsorption capacity of the adsorbent (qt) and the adsorption efficiency (Ef) were determined for all assays and by-products of acerola residue (BMS, BIO and HID). These values were calculated based on the formulas provided in Equations 8 and 9 (Nogueira et al., 2019).

where qt is the amount of adsorbate adsorbed per gram of adsorbent at time t (mg/g), C0 is the initial concentration of adsorbate (mg L-1); Ct is the concentration of adsorbate in solution at equilibrium at a given time t (mg L-1), V is the total volume of the solution (L) and mads is the mass of adsorbent (g).
Kinetic models of first and second orders were applied to the experimental data to examine the adsorption of adsorbents BMS, BIO and HID. Equilibrium isotherms were studied by varying the initial concentrations of methylene blue according to experimental requirements and fitted to Langmuir and Freundlich models.
For comparative purposes, an adsorption test was conducted with BMS, BIO and HID, and commercial activated carbon (AC) using the parameters optimized for adsorption (optimal pH, equilibrium time, and equilibrium concentration).
3 RESULTS AND DISCUSSION
3.1 Chemical Characterization of BMS, BIO, and HID
The results of the chemical characterization analyses for BMS and BIO are summarized in Table 2.
Table 2 – Chemical characteristics of BMS, BIO and HID
|
ANALYSIS
|
BMS
|
BIO
|
HID
|
|
pH
|
3.63 ± 0.18a
|
9.44 ± 0,13b
|
4.48 ± 0.01c
|
|
C (μS cm-1)
|
1061.64 ± 7.81a
|
56.23 ± 3.38b
|
48.24 ± 0.00b
|
|
PCZ
|
6.145a
|
5.83b
|
4.63c
|
|
OFG (mmol g-1)
|
QF
|
0.51 ± 0.01a
|
0.75 ± 0.01b
|
3.43 ± 0.01c
|
|
QL
|
1.29 ± 0.01a
|
1.21 ± 0.01b
|
1.37 ± 0.01c
|
|
QC
|
3.72 ± 0.01a
|
3.28± 0.01b
|
5.36 ± 0.01c
|
|
Total
|
5.52 ± 0.01a
|
5.24 ± 0.01b
|
10.16 ± 0.01c
|
|
MC w.b. (%)
|
8.95 ± 0.24a
|
1.81 ± 0.01b
|
1.59 ± 0.01b
|
|
MC d.b. (%)
|
8.21 ± 0.29a
|
1.84 ± 0.01b
|
1.61 ± 0.01b
|
|
A (%)
|
1.19 ± 0.01a
|
5.03 ± 0.03b
|
0.56 ± 0.01c
|
|
VM (%)
|
15.17 ± 1.19a
|
41.17 ± 1.85b
|
20.09 ± 0.72a
|
|
FC (%)
|
83.64 ± 1.19a
|
53.80 ± 1.85b
|
79.35 ± 0.72a
|
Source: Organized by the authors (2024). The means followed by the same letter, in each biosorbent analysis, do not differ statistically from each other using the Tukey test (p < 0.05)
The pH levels of the BMS (3.32) and HID (3.34) samples are consistent with findings reported by Leda (2017) and Costa et al. (2011). The BIO sample exhibited the highest pH, which is attributed to the partial or complete removal of acidic groups during pyrolysis. This process leads to a greater presence of basic groups compared to oxygenated functional groups. The similarity in pH between BMS and HID can be explained by the hydrothermal carbonization process, which occurs in an aqueous medium. This process helps preserve some acidic groups present in the biomass, thereby influencing the final product’s pH.
pH is a critical factor influencing biosorption efficiency and selectivity, as it affects the charge of the adsorbent’s surface. The presence of protonated or deprotonated functional groups determines the electrostatic interactions with ions in solution. Under acidic conditions (e.g., BMS and HID), the adsorbent surface carries a more negative charge, favoring cation adsorption. In contrast, under basic conditions (e.g., BIO), the surface becomes positively charged, favoring anion adsorption (Iftekhar et al., 2018). The conductivity of BIO and HID is significantly lower than that of BMS, which enhances adsorption by reducing ion competition.
The point of zero charge (PCZ) indicates the pH at which the adsorbent has no net charge, directly influencing ion adsorption. At pH values below the PCZ, the adsorbent surface is positively charged, favoring anion adsorption, while at pH values above it, the surface becomes negatively charged, favoring cation adsorption (Murthy et al., 2019). In this study, the optimal pH values for cation adsorption were determined to be above 6.145 for BMS, 5.83 for BIO, and 4.63 for HID. Comparable PCZ values have been reported in other studies (Barbosa et al., 2021; Xie et al., 2019).
Key acidic surface groups in lignocellulosic materials, including phenolic (-OH), lactonic (-C=O), and carboxylic (-COOH) groups, play a significant role in facilitating the adsorption of dye molecules and metal ions (Gadelha et al., 2023). These functional groups enable chemical reactions and interactions between the adsorbent and adsorbate, promoting the formation of surface complexes and ionic exchange (Osman et al., 2023; Zhao et al., 2018; Gadelha et al., 2023).
The BMS and BIO samples exhibited similar oxygenated functional group contents (5.52 and 5.24 mmol g–¹, respectively), whereas HID showed nearly double this amount (10.16 mmol g–¹). Previous studies (Nogueira et al., 2019; Gadelha et al., 2023) have reported lower functional group contents for various biomass sources, indicating that the samples analyzed in this study possess a higher concentration of oxygenated functional groups.
Regarding acidic functional groups, the order observed for BMS and BIO was carboxylic > lactonic > phenolic, whereas HID displayed the order carboxylic > phenolic > lactonic. Following slow pyrolysis and hydrothermal carbonization, the phenolic group content increased approximately 1.47-fold and 6.73-fold, respectively. Carboxylic groups increased only after hydrothermal carbonization, with a 1.44-fold rise. Lactonic groups exhibited a 1.06-fold increase after hydrothermal carbonization but decreased by about 93.8% following slow pyrolysis. These observations are consistent with the FT-IR analysis results, as shown in Figure 1.
Figure 1 – FT-IR diffractogram for BMS, BIO and HID
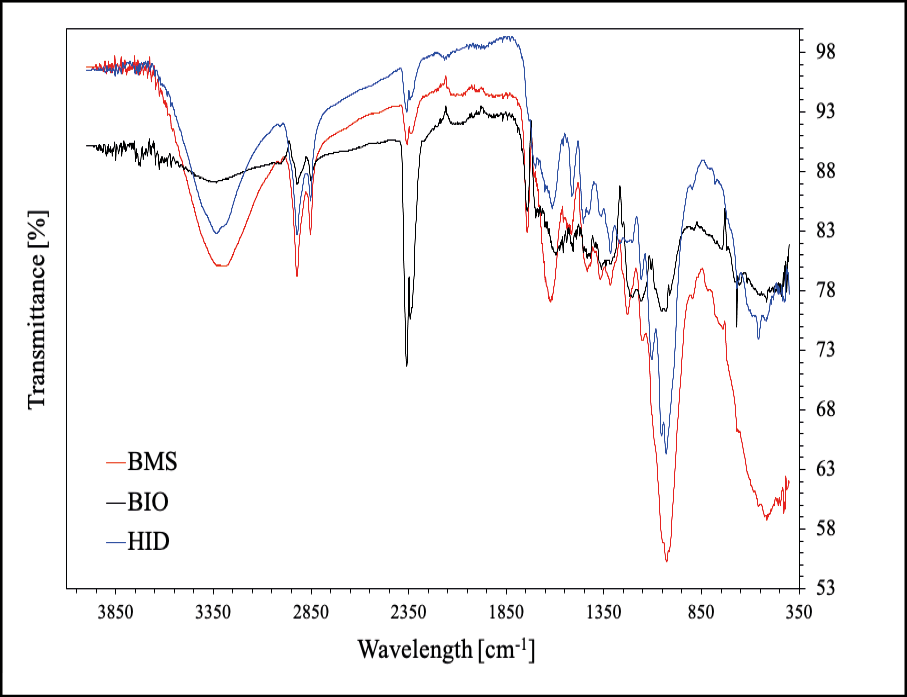
Source: Authors (2024)
The FT-IR spectra revealed broad absorption peaks between 3500 and 3300 cm–¹, associated with -OH stretching vibrations present in hydroxyl, carboxyl, phenolic, and alcoholic groups, indicative of intramolecular hydrogen bonding in cellulose (Martins, 2021). Peaks at 2923 and 2851 cm–¹ correspond to the asymmetric and symmetric stretching of -CH3 and -CH2 groups, respectively, present in cellulose, hemicellulose, and lignin (Gadelha et al., 2023; Martins, 2021; Barbosa et al., 2021). Distinct peaks at 2358 and 2341 cm–¹ are attributed to disubstituted alkyne (C≡C) groups (Barbosa et al., 2021).
The peak at 1742 cm–¹, observed only in BMS and BIO, indicates carbonyl (C=O) stretches from aliphatic esters, carboxylic acids, and ketones (Basso, 2017). Frequencies for C≡O and C–N from amide groups were also noted (Souza et al., 2018). The peak at 1622 cm–¹ suggests C=C stretching from aromatic lignin rings and/or asymmetric C–O stretches in aliphatic and aromatic carboxylates (Martins, 2021). The peak at 1027 cm–¹ indicates a combination of C–O stretching and O–H bending from polysaccharides in cellulose (Gonçalves, 2016; Martins, 2021). Peaks below 800 cm–¹ are characteristic of bioligands containing nitrogen (Souza et al., 2018).
The proximate analysis plays a crucial role in characterizing biomass for thermochemical conversion processes, as it not only determines the viability of the biochar/hydrochar produced but also suggests potential applications for the material. Moisture content is particularly significant, as high moisture can affect thermal degradation and product yield during pyrolysis. Typically, biomass for thermochemical processes requires a moisture content of less than 10% to avoid prolonged heating times and tar formation (Bridgwater, 2012; Silva & de Oliveira, 2020). In hydrothermal processes, however, initial moisture content is irrelevant, as the reaction occurs in an aqueous environment, eliminating the need for drying.
In this study, BMS showed a moisture content of 8.95 ± 0.29% (wet basis), which is within the recommended range. BIO and HID had moisture contents of 1.81% and 1.59%, respectively, both of which are considered optimal for thermochemical processes (Basso, 2017; Denari & Cavalheiro, 2012). Ash content, another key factor, impacts the efficiency of pyrolysis, as higher ash levels can lead to operational issues such as fouling and lower biochar yields (Silva & de Oliveira, 2020; Denari & Cavalheiro, 2012). BMS had an ash content of 1.19 ± 0.01%, while BIO and HID showed values of 5.03 ± 0.03% and 0.56 ± 0.01%, respectively, all of which fall within acceptable limits for biochar production (Basso, 2017; Denari & Cavalheiro, 2012).
Volatile matter (VM) content is linked to the reactivity of biomass and its potential to produce liquid fuels during pyrolysis. In this study, BMS had a VM content of 15.17 ± 1.19%, while BIO and HID had VM of 41.17 ± 1.85% and 20.09 ± 0.72%, respectively. Higher volatile matter is typically associated with increased liquid yields (Nogueira et al., 2019; Denari & Cavalheiro, 2012). Fixed carbon (FC), representing the stable fraction of the biomass, is crucial for determining biochar stability and yield. BMS showed an FC content of 83.64 ± 1.19%, BIO had 53.8 ± 1.85%, and HID exhibited 79.35 ± 0.72%, indicating high thermal stability for these materials (Nogueira et al., 2019; Denari & Cavalheiro, 2012).
A thermogravimetric analysis (TGA) provides continuous measurement of a sample’s mass relative to temperature during heating or cooling, offering insights into thermal stability, composition, and residue formation (Silva & de Oliveira, 2020). Figure 2 presents the TGA and derivative thermogravimetric (DTG) curves for three products under an inert atmosphere, revealing similar behavior across the biosorbents. The DTG highlights three significant mass loss regions.
Figure 2 – TGA and DTG in inert atmosphere for BMS, BIO and HID
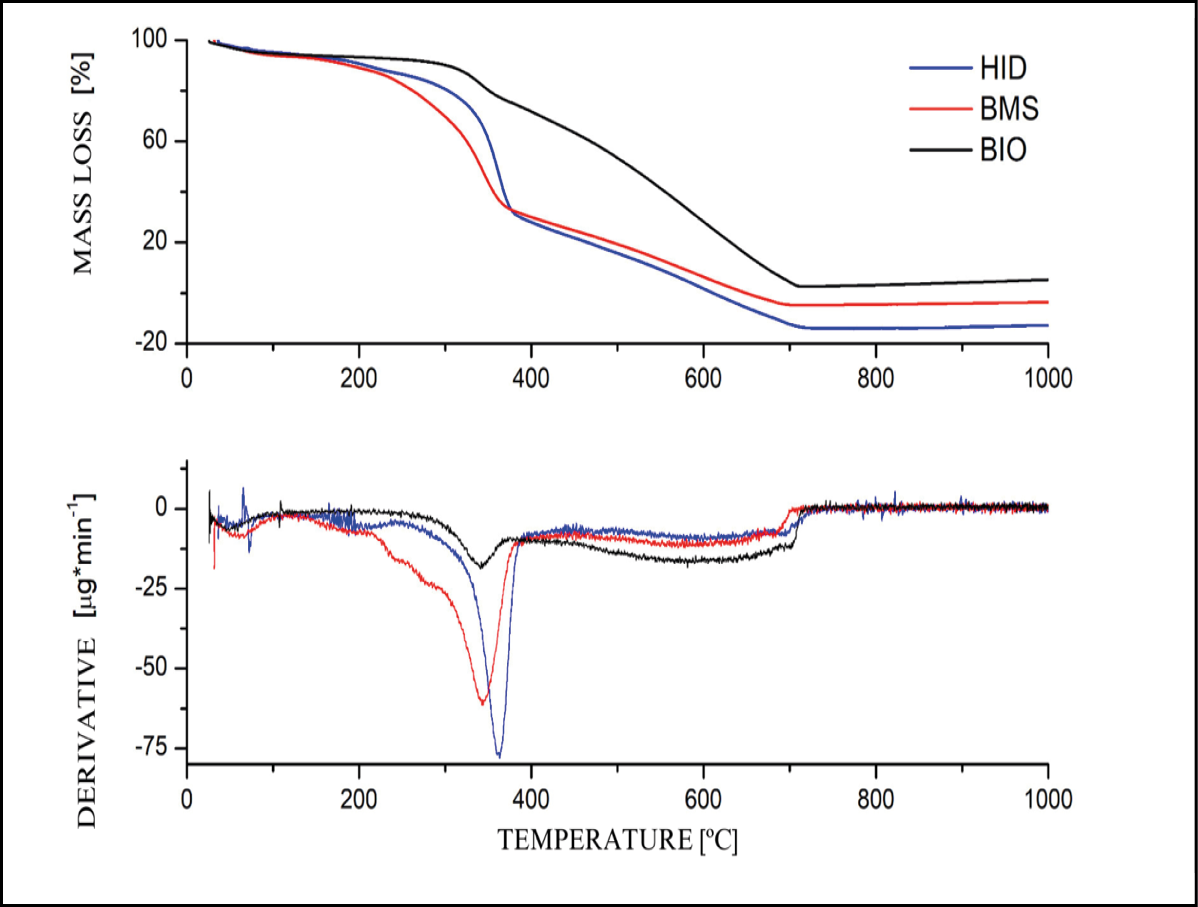
Source: Authors (2024)
The first region, from 30 to 100°C, corresponds to the biomass dehydration as moisture is removed (Praveen et al., 2022). BMS exhibits the highest water content, followed by HID, which loses more mass than BIO. This is linked to the production processes of BMS and HID, whereas BIO’s moisture content stems from atmospheric water absorption.
The second region, between 200 and 400°C, shows the greatest mass loss, with HID exhibiting the highest loss, followed by BMS and BIO. The production process of HID preserves biomass components like cellulose and lignin, while BIO undergoes partial degradation during pyrolysis, resulting in less mass loss during TGA. Hemicellulose and lignin begin degrading around 200°C and 260°C, respectively, with gradual degradation until 300°C, after which cellulose decomposition becomes rapid. At 400°C, lignin and hemicellulose undergo secondary degradation, with complex carbon rearrangements and gas release occurring above 500°C (Souza et al., 2018; Praveen et al., 2022; Valencia, 2007).
In an oxidizing atmosphere (Figure 3), mass loss occurs in three stages: moisture removal between 50 and 100°C, volatile release around 330°C, and the combustion of remaining cellulose, hemicellulose, and lignin between 400 and 500°C. These patterns are consistent across all products, mirroring the trends observed under an inert atmosphere.
Figure 3 – TGA and DTG in oxidizing atmosphere for BMS, BIO and HID

Source: Authors (2024)
3.2 Adsorption Experiments
3.2.1 Adsorption Experiments with Variation in Contact Time and pH of the Aqueous Solution
The MB removal percentage results, varying the contact time at an initial concentration of 100 mg L–¹, are shown in Figure 4. BMS achieved the highest adsorption at 80.7%, followed by HID (68%) and BIO (50%). The original composition of BMS, rich in organic and inorganic components, enhances its adsorption capacity, which is altered during slow pyrolysis and hydrothermal carbonization. These thermal processes impact the chemical composition and porosity of the biosorbents, influencing adsorption efficiency due to changes in surface area and pore structure (Osman et al., 2023; Denari & Cavalheiro, 2012). Kinetic equilibrium for HID was reached within 40 minutes, with 68% adsorption, whereas BMS and BIO reached equilibrium in 60 minutes. The faster adsorption in HID is attributed to the combined effects of electrostatic interactions and pore structure (Osman et al., 2023; Zhao et al., 2018).
Figure 4 – Influence of contact time on % removal of MB dye for BMS, BIO and HID
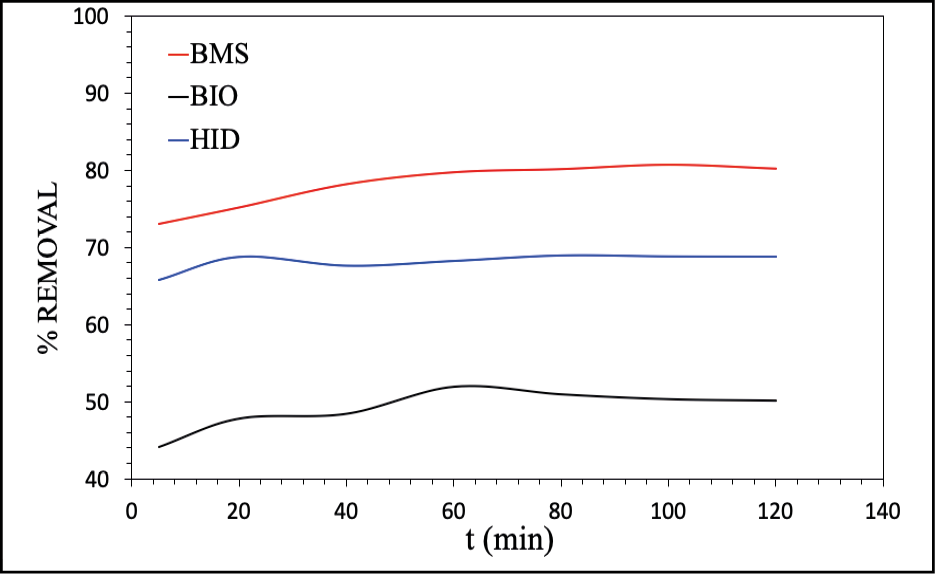
Source: Authors (2024)
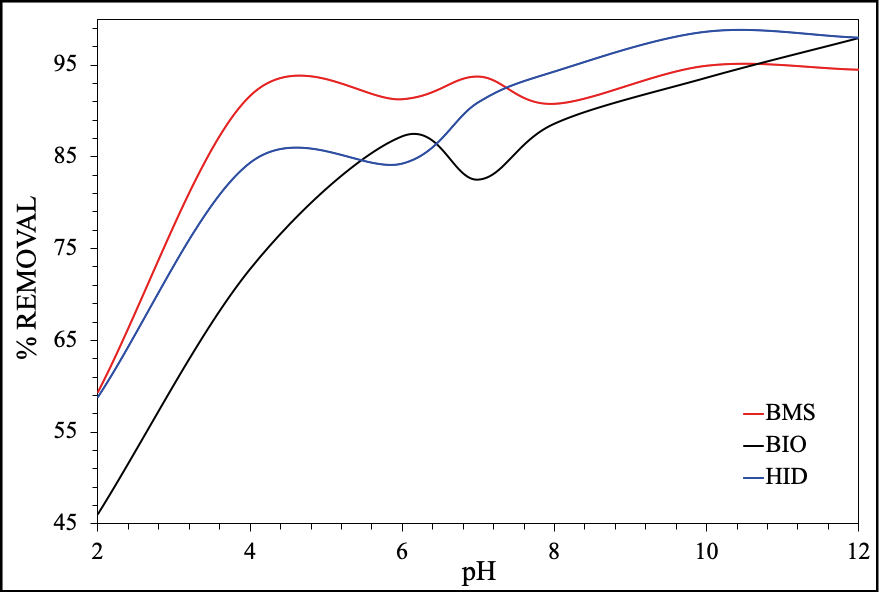
The MB removal percentage results, varying the pH at an initial concentration of 100 mg L–¹, are shown in Figure 5. From pH 4.0 onwards, all biosorbents (BMS, BIO, HID) demonstrated good adsorption, exceeding 70%. The removal efficiency increased with pH, reaching 80-93% at pH 7, indicating that higher alkalinity favors methylene blue adhesion to the biosorbent surfaces. Electrostatic interaction between the dye and the adsorbent surface plays a significant role (Zhao et al., 2018). At low pH values, H+ ions occupy active sites, limiting methylene blue adsorption due to electrostatic repulsion (Osman et al., 2023). The optimal pH range for adsorption experiments across all biosorbents is between 10 and 12, aligning with the point of zero charge (PZC) values for BMS, BIO, and HID.
Figure 5 – Influence of medium pH on the % removal of MB dye
Source: Authors (2024)
3.2.2 Adsorption kinetics and equilibrium isotherms
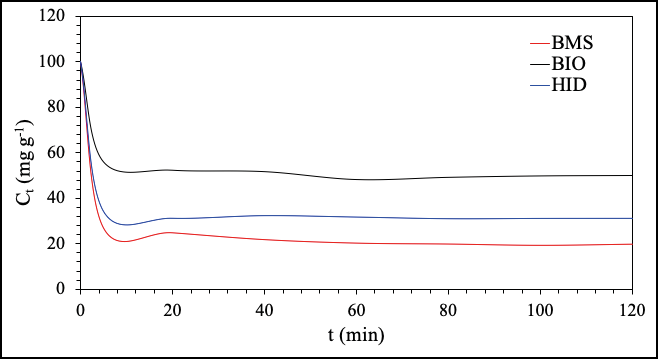
The adsorption kinetics study aimed to determine the time required for the system to reach equilibrium, where no significant changes in the methylene blue concentration in the aqueous solution occur. Adsorption kinetics curves for BMS, BIO, and HID at an initial methylene blue concentration of 100 mg L–¹ are shown in Figure 6. For BMS and HID, equilibrium was reached at 40 and 20 minutes, respectively, with solute concentrations (Ct) of 21.79 mg L–¹ and 31.23 mg L–¹, corresponding to 39.11 mg g–¹ and 34.38 mg g–¹ of adsorbed solute. For BIO, equilibrium was reached after 60 minutes, with a Ct of 48.12 mg L–¹, equivalent to 25.94 mg g–¹ of adsorbed solute.
Figure 6 – Experimental data on the adsorption kinetics of MB for BMS, BIO and HID
Source: Authors (2024)
Various factors, such as temperature, pH, ionic strength, initial adsorbate concentration, agitation, contact time, particle size, and pore size distribution, can influence adsorption kinetics (Premarathna et al., 2019; Foroughi-Dahr & Ramezani, 2015). The pseudo-first-order and pseudo-second-order models are commonly used to describe adsorption kinetics. Table 3 presents the adsorption rate constants (k1 and k2), equilibrium adsorption capacities (qe), and correlation coefficients (r²) for both models. The pseudo-second-order model exhibited the highest r² values for all products, and the qe values were consistent with those in Figure 6, indicating that MB adsorption follows the pseudo-second-order model for BMS, BIO, and HID.
Table 3 – Parameters of pseudo-first and pseudo-second order models for methylene blue adsorption kinetics
|
Product
|
Pseudo-first order
|
Pseudo-second order
|
|
Parameter
|
Value
|
Parameter
|
Value
|
|
BMS
|
qe
|
10.16a
|
qe
|
40.49a
|
|
k1
|
0.05a
|
k2
|
0.03a
|
|
r2
|
0.67
|
r2
|
>0.99
|
|
BIO
|
qe
|
22.74b
|
qe
|
25.32b
|
|
k1
|
0.0047b
|
k2
|
0.08b
|
|
r2
|
0.37
|
r2
|
>0.99
|
|
HID
|
qe
|
11.66c
|
qe
|
34.48c
|
|
k1
|
0.0086c
|
k2
|
0.12c
|
|
r2
|
0.31
|
r2
|
1
|
Source: Authorship (2024). The means followed by the same letter, in each biosorbent analysis, do not differ statistically from each other using the Tukey test (p < 0.05)
Equilibrium isotherms were studied for the MB/biosorbent system, using the linear forms of the Langmuir and Freundlich models. Table 4 and Figure 7 display the experimental data and fitted models. The Langmuir model provided the best fit (highest r² values) for all products. A Freundlich isotherm parameter of 1/n < 1 suggests a normal Langmuir isotherm, supporting the Langmuir model’s adequacy for the equilibrium data (Jawad et al., 2018).
Figure 7 – Langmuir and Freundlich models adjusted for the three biosorbents
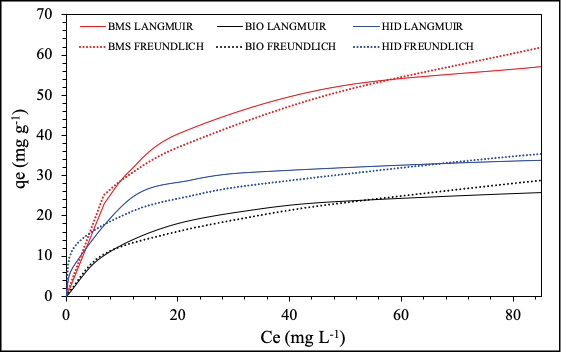
Source: Authors (2024)
Table 4 – Fitting parameters of Langmuir and Freundlich isotherms
|
Product
|
Isotherm
|
Parameter
|
Value
|
|
BMS
|
Langmuir
|
KL
|
0.08a
|
|
qm
|
65.57a
|
|
r2
|
>0.99
|
|
Freundlich
|
KF
|
12.71a
|
|
n
|
2.81a
|
|
r2
|
0.91
|
|
BIO
|
Langmuir
|
KL
|
0.08a
|
|
qm
|
29.98b
|
|
r2
|
>0.99
|
|
Freundlich
|
KF
|
4.78b
|
|
n
|
2.47b
|
|
r2
|
0.91
|
|
HID
|
Langmuir
|
KL
|
0.18b
|
|
qm
|
36.05c
|
|
r2
|
>0.99
|
|
Freundlich
|
KF
|
11.11c
|
|
n
|
3.82c
|
|
r2
|
0.90
|
Source: Authorship (2024)
The means followed by the same letter, in each biosorbent analysis, do not differ statistically from each other using the Tukey test (p < 0.05)
The Langmuir maximum adsorption capacity (qm) was 65.57 mg g–¹ for BMS, 29.98 mg g–¹ for BIO, and 36.05 mg g–¹ for HID. Experimental values for BIO and HID were close, at 25.95 mg g–¹ and 34.53 mg g–¹, respectively, while BMS showed a larger discrepancy, with an experimental value of 57.35 mg g–¹. The relative errors between Langmuir model predictions and experimental equilibrium isotherm values were 12.53% for BMS, 13.57% for BIO, and 4.23% for HID.
Comparable studies report adsorption capacities of 52.35 mg g–¹ for acerola biomass-based adsorbents (Xie et al., 2019) and up to 95.52 mg g–¹ for hydrochar from acerola waste (Nogueira et al., 2019). The Langmuir separation factor (RL), used to assess adsorption favorability, was calculated (Table 5). All RL values were within the favorable range of 0 < RL < 1, suggesting that the adsorption process is favorable. Increasing the initial concentration tends to make adsorption more irreversible, as observed in previous studies (Nogueira et al., 2019; Foroughi-Dahr & Ramezani, 2015).
Table 5 – Dimensionless Langmuir (RL) separation parameter for methylene blue adsorption on BMS, BIO and HID
|
Product
|
INITIAL CONCENTRATION OF MB (mg L-1)
|
|
25
|
50
|
80
|
100
|
150
|
200
|
|
BMS
|
0.33
|
0.20
|
0.13
|
0.11
|
0.08
|
0.06
|
|
BIO
|
0.34
|
0.21
|
0.14
|
0.11
|
0.08
|
0.06
|
|
HID
|
0.18
|
0.10
|
0.06
|
0.05
|
0.04
|
0.03
|
Source: Authorship (2024). The means followed by the same letter, in each biosorbent analysis, do not differ statistically from each other using the Tukey test (p < 0.05)
3.2.3 Comparison with activated charcoal (AC)
A comparative adsorption test was conducted using BMS, BIO, HID, and commercial activated carbon (AC) under optimal conditions: pH 10, 60 minutes of contact time, and an initial adsorbate concentration of 100 mg/L. The results are summarized in Table 6.
Table 6 – Adsorption experiment of BMS, BIO and HID comparing with commercial activated carbon
|
Product
|
MB solution (mg L-1)
|
|
qt (mg g-1)
|
%Removal
|
|
BMS
|
47.49a
|
94.97
|
|
BIO
|
48.97a
|
97.94
|
|
HID
|
49.33b
|
98.66
|
|
AC
|
47.97a
|
95.94
|
Source: Authorship (2024). The means followed by the same letter, in each biosorbent analysis, do not differ statistically from each other using the Tukey test (p < 0.05)
The biosorbents (BMS, BIO, and HID) showed very similar adsorption capacities, with a narrow variation of only 1.84 mg g–¹, indicating comparable efficiency in removing methylene blue from aqueous solutions. In contrast, commercial activated carbon exhibited a slightly lower adsorption capacity of 47.97 mg g–¹, suggesting that biosorbents could serve as viable alternatives, especially when considering factors like cost, availability, and environmental impact.
When environmental sustainability is considered, hydrochar shows to be the most promising biosorbent among the studied materials. Despite its slightly lower adsorption capacity compared to BMS, it demonstrated excellent performance under optimal conditions and required lower energy input than slow pyrolysis. Furthermore, hydrochar showed the highest content of oxygenated functional groups, which enhances interaction with pollutants. Its production under milder and aqueous conditions also aligns with green chemistry principles.
4 CONCLUSIONS
This study identified acerola (Malpighia Emarginata D.C.) residue as a promising natural biomass for thermoconversion processes. Adsorption tests revealed that contact time and solution pH significantly influence adsorbate removal and adsorption capacity, with optimal results at 60 minutes of contact time and a pH range of 10 to 12. Without pH adjustment, BMS demonstrated an adsorption capacity of 57.35 mg g⁻¹, outperforming BIO by ٢.٢١ times and HID by ١.٦٦ times due to chemical transformations during slow pyrolysis and hydrothermal carbonization.
Under optimal conditions (pH 10-12, 60 minutes contact time, and 100 mg L⁻¹ MB concentration), HID adsorbed the most dye (٤٩.٣٣ mg g⁻¹), followed by BIO (٤٨.٩٧ mg g⁻¹) and BMS (٤٧.٤٩ mg g⁻¹), achieving removal rates of ٩٨.٦٦٪, ٩٧.٩٤٪, and ٩٤.٩٧٪, respectively. When compared with commercial activated carbon, these bioproducts exhibited comparable adsorption efficiency with potential environmental sustainability benefits. The results also demonstrate that BMS, despite not undergoing thermal treatment, displayed a similar or higher adsorption capacity in some tests, indicating its potential as a low-cost and effective biosorbent. This highlights the importance of evaluating not only thermally modified materials but also untreated biomass in adsorption studies. In this way, the three biosorbents studied are suitable adsorbents for dye removal from aqueous solutions.
REFERENCES
Ali, I., Asim, M., & Khan, T. A. (2012). Removal of basic dye from wastewater using a novel composite adsorbent. Journal of Environmental Management, 113, 170–176. doi: 10.1016/j.jenvman.2012.08.032
Ali, R. M., Alshahrani, S. M., & Albassam, A. (2016). Adsorption of methylene blue dye from aqueous solution onto activated carbon prepared from date pits. Ecological Engineering, 91, 317–325. doi: 10.1016/j.ecoleng.2016.03.005
ASTM International. (2004). ASTM D3174-04: Standard method for ash in the analysis sample of coal and coke. ASTM International.
ASTM International. (1998a). ASTM E1534-93: Standard test method for determination of ash content of particulate wood fuels. ASTM International.
ASTM International. (1998c). ASTM E872-82: Standard test method for volatile matter in the analysis of particulate wood fuels. ASTM International.
Bashir, K., Khan, S., Ali, R., Yasmin, H., Gaafar, A.-R. Z., Khilgee, F. E. A., Butt, S., & Ullah, A. (2023). Advances in biosorption technologies for water purification. Sustainability, 15(7), 14056. doi: 10.3390/su150714056.
Belwal, T., Nabavi, S. F., Nabavi, S. M., & Habtemariam, S. (2018). The effects of polyphenols in traditional medicine: An updated overview. Trends in Food Science & Technology, 74, 99–108. doi: 10.1016/j.tifs.2018.02.002.
Bridgwater, A. V. (2012). Review of fast pyrolysis of biomass and product upgrading. Biomass and Bioenergy, 38, 68–94. doi: 10.1016/j.biombioe.2011.01.048.
Buratti, C., Barbanera, M., Lascaro, E., & Fantozzi, F. (2018). Sustainability analysis of biochar production from orchard pruning residues. Waste Management, 73, 523–534. doi: 10.1016/j.wasman.2017.11.050.
Costa, W. F., Nunes, A. A., Barbosa, A. A., & Oliveira, J. A. P. (2021). Study of adsorption kinetics and isotherms using agricultural waste. Ciência Natura, 43(1), 12–23. doi: 10.5902/2179460X43652.
Cruz, G. J. F., Kalu, E. E., & Machado, A. E. H. (2015). Photocatalytic degradation of pollutants in wastewater. Water, Air, & Soil Pollution, 226, 19. doi: 10.1007/s11270-014-2274-2.
Deolin, M. H. S., Mendes, M. R. S., Moreno, L. M. B., & Andrade, M. B. (2013). Caracterização química de resíduos agroindustriais para adsorção de poluentes. Anais do VIII EPCC - Encontro Internacional de Produção Científica Cesumar. Maringá, Brasil.
Denari, G. B., & Cavalheiro, E. T. G. (2012). Princípios e aplicações de análise térmica. São Carlos: Universidade de São Paulo.
Gadelha, A. J. F., Costa, W. F., Oliveira, J. A. P., Souza, W. D. M., & Lima, J. R. (2023). Adsorption of dyes using modified agricultural residues. Water Practice & Technology, 18(3), 1465–1480. doi: 10.2166/wpt.2023.002
Guimarães, B. Q. (2021). Desenvolvimento de biossorventes para tratamento de efluentes. [Dissertação de Mestrado, Universidade Federal do Espírito Santo]. http://repositorio.ufes.br/handle/10/15450
Hatiya, N. A., Reshad, A. S., & Negie, Z. W. (2022). Advances in adsorption technologies for dye removal. Adsorption Science & Technology. doi: 10.1177/02636174211059649
Instituto Adolfo Lutz. (2008). Métodos físico-químicos para análise de alimentos (4ª ed.). São Paulo: Instituto Adolfo Lutz.
Jawad, A. H., Kadhum, A. M., & Ngoh, Y. S. (2018). Adsorption of methylene blue using chitosan-modified materials. Desalination and Water Treatment, 109, 231–240. doi: 10.5004/dwt.2018.21601.
Kumar, A., Sidharth, S., & Kandasubramanian, B. (2023). Recent developments in biosorption of pollutants. Environmental Science and Pollution Research, 30(10), 39474–39495. doi: 10.1007/s11356-022-24853-1.
Li, W., Mu, B., & Yang, Y. (2019). Adsorption of pollutants using biochar-based adsorbents: A review. Bioresource Technology, 277, 157–165. doi: 10.1016/j.biortech.2019.01.101.
Mishra, R. K. (2023). Fresh water availability and its global challenge. British Journal of Multidisciplinary and Advanced Studies, 4(3), 1-78. doi: 10.37745/bjmas.2022.0208.
Nascimento, J. M., & Oliveira, J. D. (2017). Caracterização de biossorventes para remoção de poluentes. Revista Virtual de Química, 9(3), 1087–1101. doi: 10.21577/1984-6835.20170064.
Nogueira, G. D. R., Duarte, C. R., & Barrozo, M. A. S. (2019). Produção de carvão ativado a partir de resíduos agroindustriais. Waste Management, 95, 466–472. doi: 10.1016/j.wasman.2019.07.020.
Osman, A. I., Farrell, C., Al-Muhtaseb, A. H., Harrison, J., & Rooney, D. W. (2023). Advances in thermochemical conversion of biomass. Environmental Chemistry Letters. doi: /10.1007/s10311-022-01408-3.
Peng, L., Li, M., Wang, Z., Li, Y., Wu, J., & Chen, Z. (2023). Hydrothermal carbonization of agricultural residues for biochar production. Chemosphere, 327, 138529. doi: 10.1016/j.chemosphere.2023.138529.
Premarathna, K. S. D., Weligama, U. A., & Jayasinghe, R. (2019). Adsorption of dyes onto natural biosorbents. Chemical Engineering Journal, 372, 536–546. https://doi.org/10.1016/j.cej.2019.04.112
Sahay, P., Parhi, P. K., Kumar, S., Pathak, R. K., Kumari, S., & Kumar, V. (2023). Advances in adsorption technologies for environmental remediation. Emerging Materials Research. doi: 10.1680/jemmr.2023.12.00045.
Shrestha, R. K., Jacinthe, P. -A., Lal, R., Lorenz, K., Singh, M. P., Demyan, S. M., Ren, W., Lindsey & L. E. (2023). Biochar as a negative emission technology: A synthesis of field research on greenhouse gas emissions. Journal of Environmental Quality, 52(4). doi: 10.1002/jeq2.20475.
Silva, J. D. O. da, & Oliveira, A. D. (2020). Sustainable adsorption technologies for water treatment. Waste Management, 107, 143–154. doi: 10.1016/j.wasman.2020.04.001.
Souza, W. D. M., Vieira, M. G. A., & Silva, M. G. C. (2018). Utilization of agricultural waste for wastewater treatment. Waste Management, 78, 356–367. doi: 10.1016/j.wasman.2018.04.028.
Valencia, C. A. V. (2007). Aplicação da adsorção em carvão ativado no tratamento de águas contaminadas. [Dissertação de Mestrado, Pontifícia Universidade Católica do Rio de Janeiro]. https://www.maxwell.vrac.puc-rio.br/23452/24342
Waheed, A., Xu, H., Qiao, X., Aili, A., Yiremaikebayi, Y., Haitao, D. & Muhammad, M. (2024). Biochar in sustainable agriculture and Climate Mitigation: Mechanisms, challenges, and applications in the circular bioeconomy. Biomass and Bioenergy, 193, 107531. doi: 10.1016/j.biombioe.2024.107531.
Zhao, X., Ma, X., & Zheng, P. (2018). Removal of pollutants using lignocellulosic biosorbents. Chemosphere, 202, 298–305. doi: 10.1016/j.chemosphere.2018.03.101.
Zhou, Y., Zhang, L., & Cheng, Z. (2015). Advances in adsorption technologies for wastewater treatment. Journal of Molecular Liquids, 212, 739–750. doi: 10.1016/j.molliq.2015.09.032.
Authorship contributions
1 – Gabriela Regina Rosa Galiassi
Master’s in Technological and Environmental Chemistry from IFMT/Cuiabá Bela Vista
https://orcid.org/0000-0003-1850-2570 • gabigaliassi@gmail.com
Contribution: Conceptualization, Data curation, Formal Analysis, Investigation, Methodology, Project administration, Software, Validation, Writing - original draft, Writing - review & editing
2 – Elaine de Arruda Oliveira Coringa
PhD in Tropical Agriculture / Natural Resources - Soil Chemistry and Mineralogy from the Federal University of Mato Grosso
https://orcid.org/0000-0001-7099-3878 • elaine.coringa@ifmt.edu.br
Contribution: Formal Analysis, Funding acquisition, Methodology, Project administration, Resources, Supervision, Validation, Visualization
3 – Josias do Espírito Santo Coringa
PhD in Chemistry from the São Paulo State University Júlio de Mesquita Filho.
https://orcid.org/0000-0001-9489-8234 • josias.coringa@ifmt.edu.br
Contribution: Funding acquisition, Resources, Supervision, Validation, Visualization
How to quote this article
Galiassi, G. R. R., Coringa, E. A. O., & Coringa, J. E. S. (2026). Study of the application of biomass, biochar and hydrochar from acerola waste (Malpighia Emarginata D.C.) as biosorbents for methylene blue in aqueous solution. Ciencia e Natura, 48, e88718. DOI: 10.5902/2179460X88718. Available in: https://doi.org/10.5902/2179460X88718